Real estate has become a popular avenue for people looking to diversify their income streams and potentially hedge against inflation. Whether you’re a seasoned pro or just getting started in investing, Richmond, VA, is certainly worth considering. Originally named after a suburb of London, this charming city has close roots to the industrial revolution and the early years of American history. Today the city still retains plenty of historic charm while boasting modern-day magic, allowing its residents access to a vibrant culture with deep roots in the past. But what about the Richmond real estate market? What do stats and trends look like, especially right now? Facts and figures are constantly changing, so we’ve gathered all the most up-to-date information for you. Here are some of the top trends for the Richmond real estate market in February 2024:
Richmond General Statistics
- Population (city proper): 232,981 (up 6% since 2020)
- Population (metro area): 1,341,227
- Area (city proper): 59.9 sq. mi.
- Area (metro area): 4,364.4 sq. mi.
- Median Age: 34.8
- GDP: $93.6 Billion
- Unemployment rate: 3.1% (down .1% since September 2023)
- Top employers: Brink’s, CarMax, Precision Power LLC, Performance Food Group, James River Group, MeadWestvaco, Dominion Energy, Estes Express Lines, Reynolds Metals Company, Apex Systems.
- Highest paying jobs: Anesthesiologist, Oncologist, Trauma Surgeon, Oral Surgeon, Oral and Maxillofacial Surgeon, Physician, Transplant Surgeon, Allergist/Pediatric Pulmonologist, Hospitalist Physician, Anesthesiologist/Physician.
- Median income (per capita): $41,970
- Median income (household): $58,988
Richmond Real Estate Market Statistics
- Neighborhoods: 123
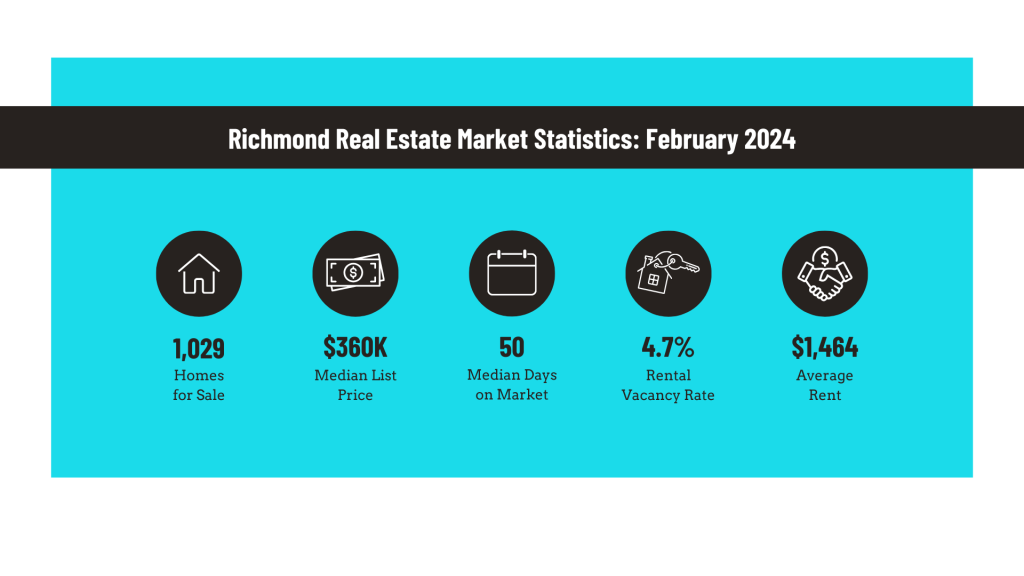
- Homes for sale as of February 2023: 1,029
- Median list price: $359.7K (down 2% since May 2023)
- Median sold price: $349.5K (up .2% since May 2023)
- Sale-to-list price ratio: 100%
- Median price per square foot: $230
- Median days on market: 50 (up 4% since December 2022)
- Rental vacancy rate: 4.7%
- Homeowner vacancy rate: .9%
- One-year appreciation rate: 2.5%
- Average rent: $1,464
- Price-to-rent ratio: 22.24
- Most expensive neighborhoods:
| Neighborhood | Average Monthly Rent | Median Listing Price |
| Windsor Farms | $3,127 | $1,455,267 |
| Shockoe Bottom | $2,444 | $992,438 |
| The Fan | $2,240 | $907,791 |
| Fan District North | $2,486 | $880,104 |
| Westhampton | $3,032 | $848,581 |
- Least expensive neighborhoods:
| Neighborhood | Median Monthly Rent | Median Listing Price |
| Southwood/ Midlothian | $1,822 | $163,658 |
| Davee Gardens | $1,887 | $178,448 |
| Jeff Davis | $2,134 | $135,069 |
| Westover | $2,178 | $205,122 |
| McGuire Manor/ Belt Center | $2,267 | $193,410 |
Final Thoughts: Richmond Real Estate Market Trends in February 2024
The Richmond real estate market is constantly changing and evolving. But the potential for investors to profit is near-constant. Whether you’re an experienced real estate investor or brand new to the industry, the Richmond real estate market could provide ample opportunity to build your portfolio.
Get Started Buying Homes With Evernest
Whether you’re purchasing one Richmond home or one hundred, you don’t have to go it alone. If you’re ready to buy your first (or next) investment property, here are three steps to get started today:
- Subscribe to our podcast: The Evernest Real Estate Investor Podcast—for all things real estate investing, being a landlord, growing your portfolio, and more.
- Find a property: Make sure you sign up for our Pocket Listings to get notified of all the deals that come across our desk daily.
- Get an investor-friendly agent: We can help with that—we would love to help you buy your next rental property investment.